Indicator 02 of 06
Barometer
Your complete automated level map
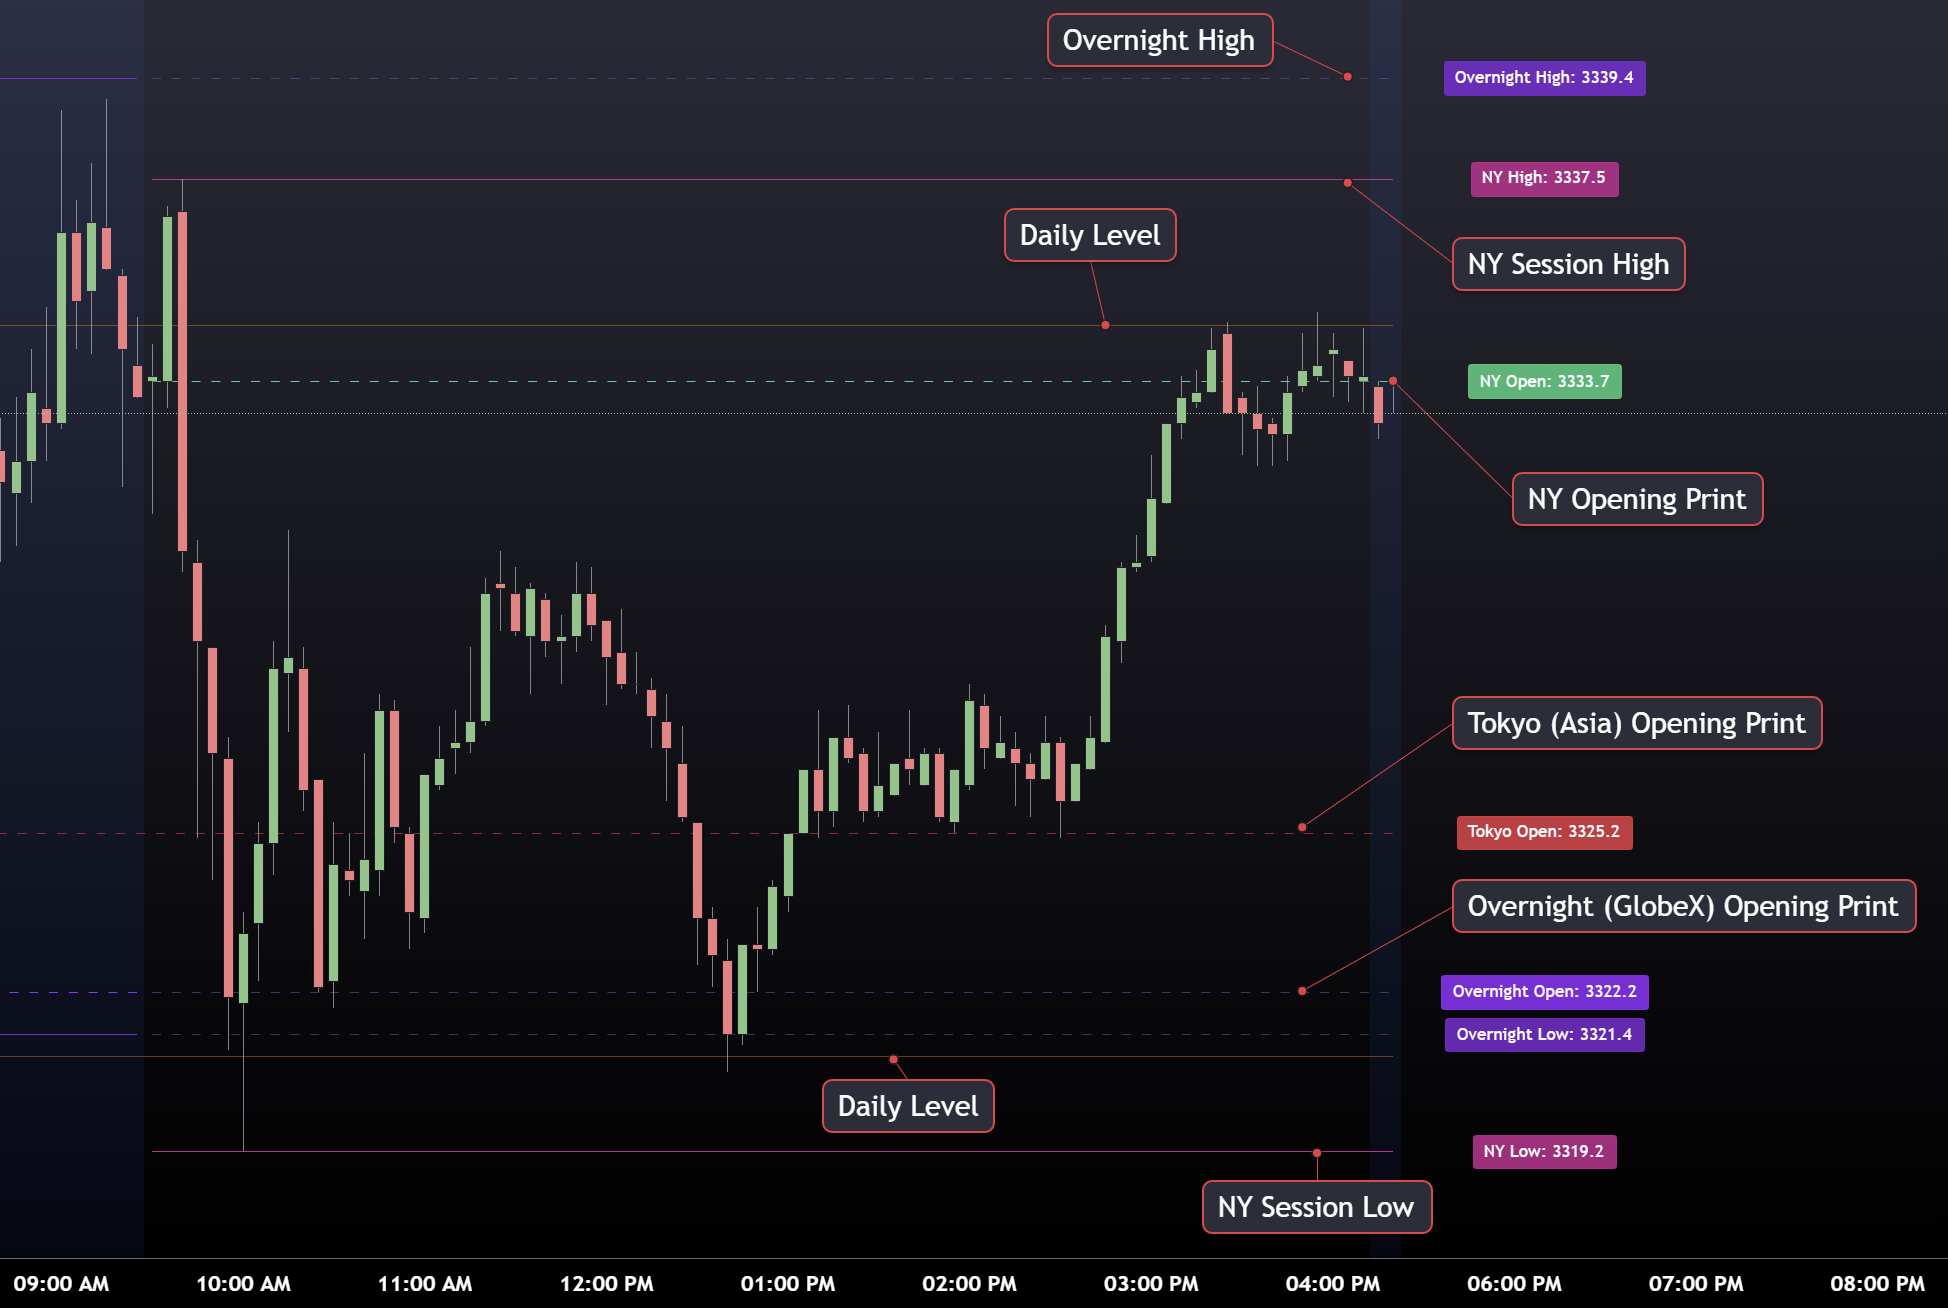
Barometer is the institutional roadmap of your chart, automatically drawing every key price level across all major trading sessions, candle structure, ORB zones, and Fibonacci levels. Every session, drawn for you, so you can focus on the trade.
On the chart
What it does
- Session Highs, Lows & Opening Prints
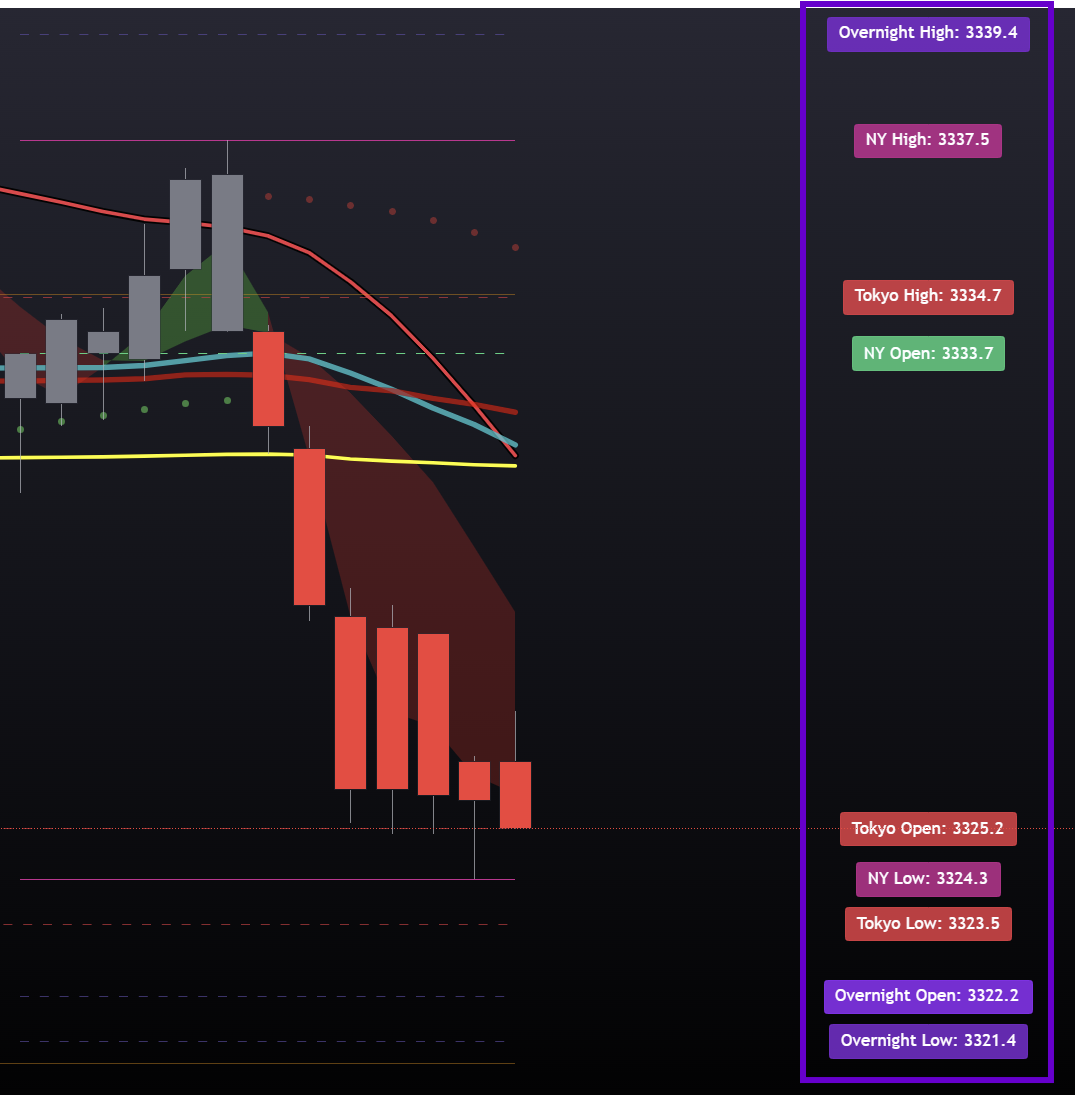
- Auto-plots the high, low, and opening print (OP) for every major session: New York, London, GlobeX/Overnight, and Asia. Opening Prints are among the most powerful intraday magnets, price revisits them constantly. You'll always know where they are.
- Daily & Weekly Candle Structure
- The key historical candle levels that institutional money watches, auto-calculated from prior session and weekly candle data, plotted on your chart without any manual work. Pair them with daily Fibonacci retracements from the prior day's range and you have a complete reference map before the open.
- Full Opening Range Breakout System
- A complete ORB engine built in: the ORB box, full extension targets for breakout levels and mean-reversion zones, and ORB Liquidity Zones where stop orders cluster. Fully configurable per session, breakout or fade, it's covered.
- Continuation Lines & Timing Zones
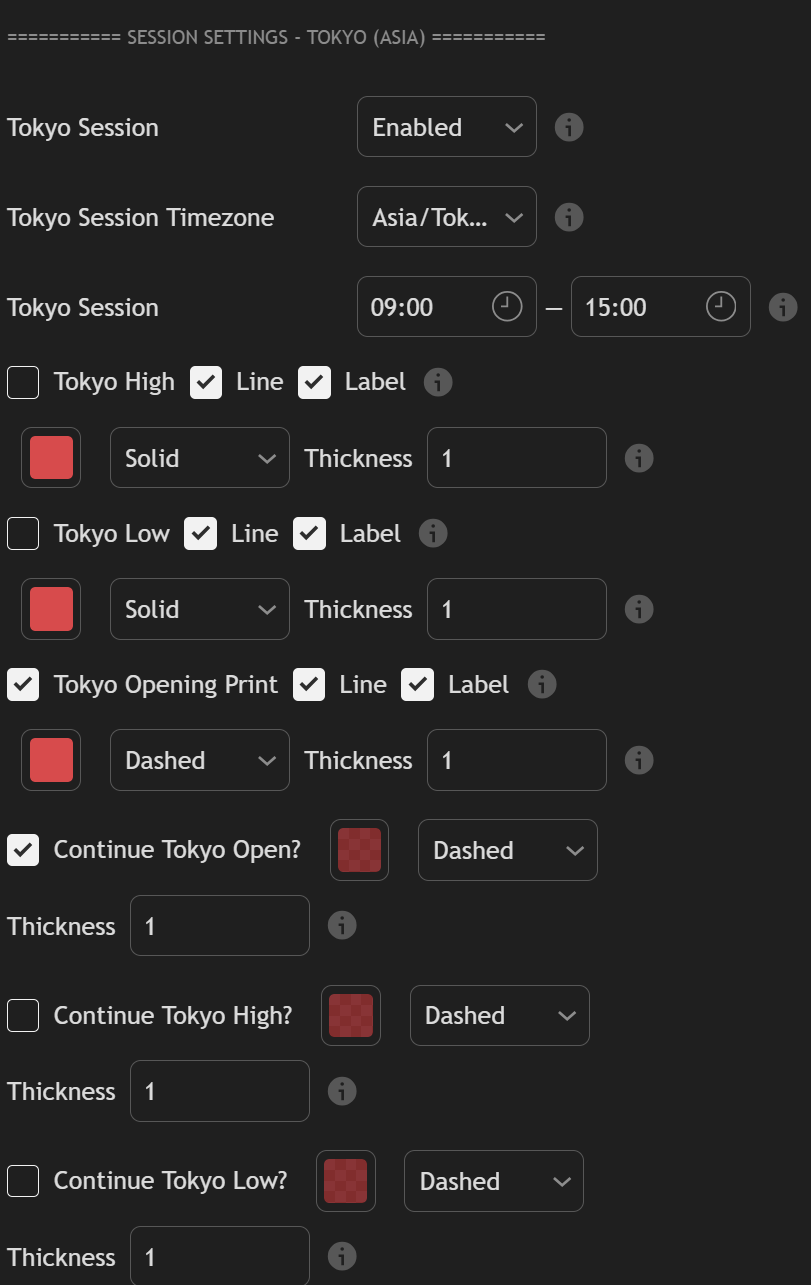
- Continue Lines extend Overnight High/Low and GlobeX Open levels into the active session so you never lose track of overnight context. The London Close Zone marks a window that consistently triggers reversals and liquidity grabs. Master Session Controls let you toggle any layer globally with one click.
Levels drawn automatically every session
- NY, London, GlobeX, and Asia session highs, lows & OPs
- Prior Day High / Prior Day Low (PDH / PDL)
- Key prior candle structure from daily and weekly timeframes
- Daily Fibonacci retracements from prior day range
- ORB box, extension targets, and liquidity zones
- London Close Zone and Continue Lines into RTH
FAQ
Barometer
questions
- Which trading sessions does Barometer plot?
- Barometer automatically draws the high, low and opening print for the New York, London, GlobeX/Overnight and Asia sessions. Master Session Controls let you toggle any of these layers on or off with a single click.
- Does Barometer include an opening range breakout system?
- Yes. Barometer has a complete ORB engine: the opening range box, extension targets for both breakout levels and mean-reversion zones, and ORB Liquidity Zones marking where stop orders cluster. It is configurable per session, so it supports both breakout and fade approaches.
- What is an opening print and why does it matter?
- The opening print is the first traded price of a session. Barometer plots it for every major session because opening prints act as strong intraday magnets — price returns to them repeatedly through the day.
- Do I have to draw prior day high and low levels myself?
- No. Barometer calculates prior day high and low, prior daily and weekly candle structure, and daily Fibonacci retracements from the previous day's range automatically, so the reference map is on the chart before the open.
The rest of the suite
Barometer does not
work alone.
Each of the six indicators answers a different question. Together they cover trend, levels, momentum and confirmation on the same chart.
Get Barometer and
the full suite.
All six TradingView indicators, the members portal and the Discord community, with a 10-day free trial.