Indicator 03 of 06
MTFA/MAG7 Matrix
The 30,000-foot view
Monitor up to six futures markets across multiple timeframes simultaneously, or track all 7 Magnificent stocks in real-time. One glance tells you which markets are moving, where alignment is strongest, and when tech is rotating before the rest of the market catches on.
On the chart
What it does
- MTFA Mode
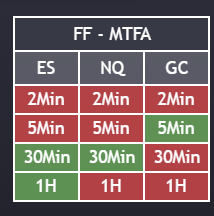
- Track ES, NQ, GC, CL, YM, and RTY across four timeframes, from 2-minute scalps to 1-hour swings. When all timeframes align on one instrument, you have the highest-probability setup the matrix can show you.Six markets, four timeframes, one panel
- MAG7 Tracker Mode
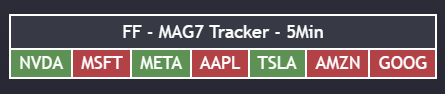
- Monitor all 7 Magnificent stocks color-coded by trend on your chosen timeframe. When the MAG7 align, the market is telling you something, these seven names represent roughly 30% of S&P 500 market cap.NVDA, MSFT, META, AAPL, TSLA, AMZN, GOOGL
- Color-Coded Trend Matrix
- Proprietary trend detection displayed as a clean color grid. Green = bullish, red = bearish. No interpretation required. Spot alignment or divergence across markets in under a second.
- Fully Customizable Layout
- Place the matrix anywhere on your chart (8 anchor positions). Small, Medium, or Large sizing adapts to any screen or multi-monitor setup without cluttering your price action.
Why it matters
- Multi-Market Correlation
- See when ES and NQ move together or diverge. Understand risk-on vs risk-off in real time, before the headlines catch up.
- Multi-Timeframe Alignment
- When all timeframes on one instrument agree, those are your highest-probability setups. The matrix makes alignment impossible to miss.
- Tech Sector Pulse
- The MAG7 represent ~30% of S&P 500 market cap. See when tech is leading or lagging before it shows up in the broader indices.
- One-Glance Decision Making
- Everything you need to understand market structure in one clean visual table. No scrolling through charts. No missing the move.
FAQ
MTFA/MAG7 Matrix
questions
- Which markets does the MTFA Matrix track?
- In MTFA mode the matrix tracks six futures markets — ES, NQ, GC, CL, YM and RTY — across four timeframes at once, from 2-minute scalps up to 1-hour swings. In MAG7 mode it tracks NVDA, MSFT, META, AAPL, TSLA, AMZN and GOOGL on a timeframe you choose.
- What does it mean when the matrix is all one color?
- When every timeframe on a single instrument agrees, that alignment marks the highest-probability setup the matrix can show. Across instruments, broad agreement points to a risk-on or risk-off market; disagreement points to rotation or divergence.
- Why track the Magnificent 7 as a futures trader?
- The seven names carry roughly 30% of S&P 500 market cap, so when they move together the index usually follows. Watching them in the matrix shows tech leading or lagging before it registers in the broader indices.
- Can I move the matrix out of the way of price action?
- Yes. The panel can be anchored in any of eight positions on the chart and set to Small, Medium or Large, so it fits a single screen or a multi-monitor layout without covering price.
The rest of the suite
MTFA/MAG7 Matrix does not
work alone.
Each of the six indicators answers a different question. Together they cover trend, levels, momentum and confirmation on the same chart.
Get MTFA/MAG7 Matrix and
the full suite.
All six TradingView indicators, the members portal and the Discord community, with a 10-day free trial.